Overview
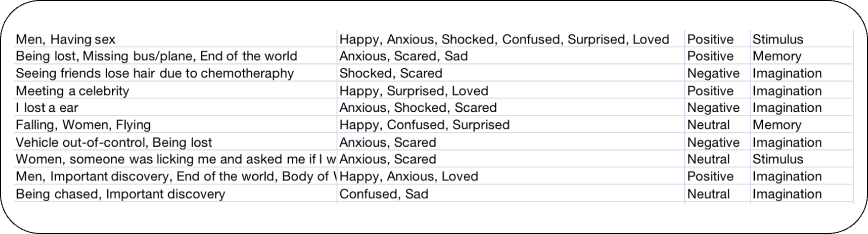
Data Collection
Ideation
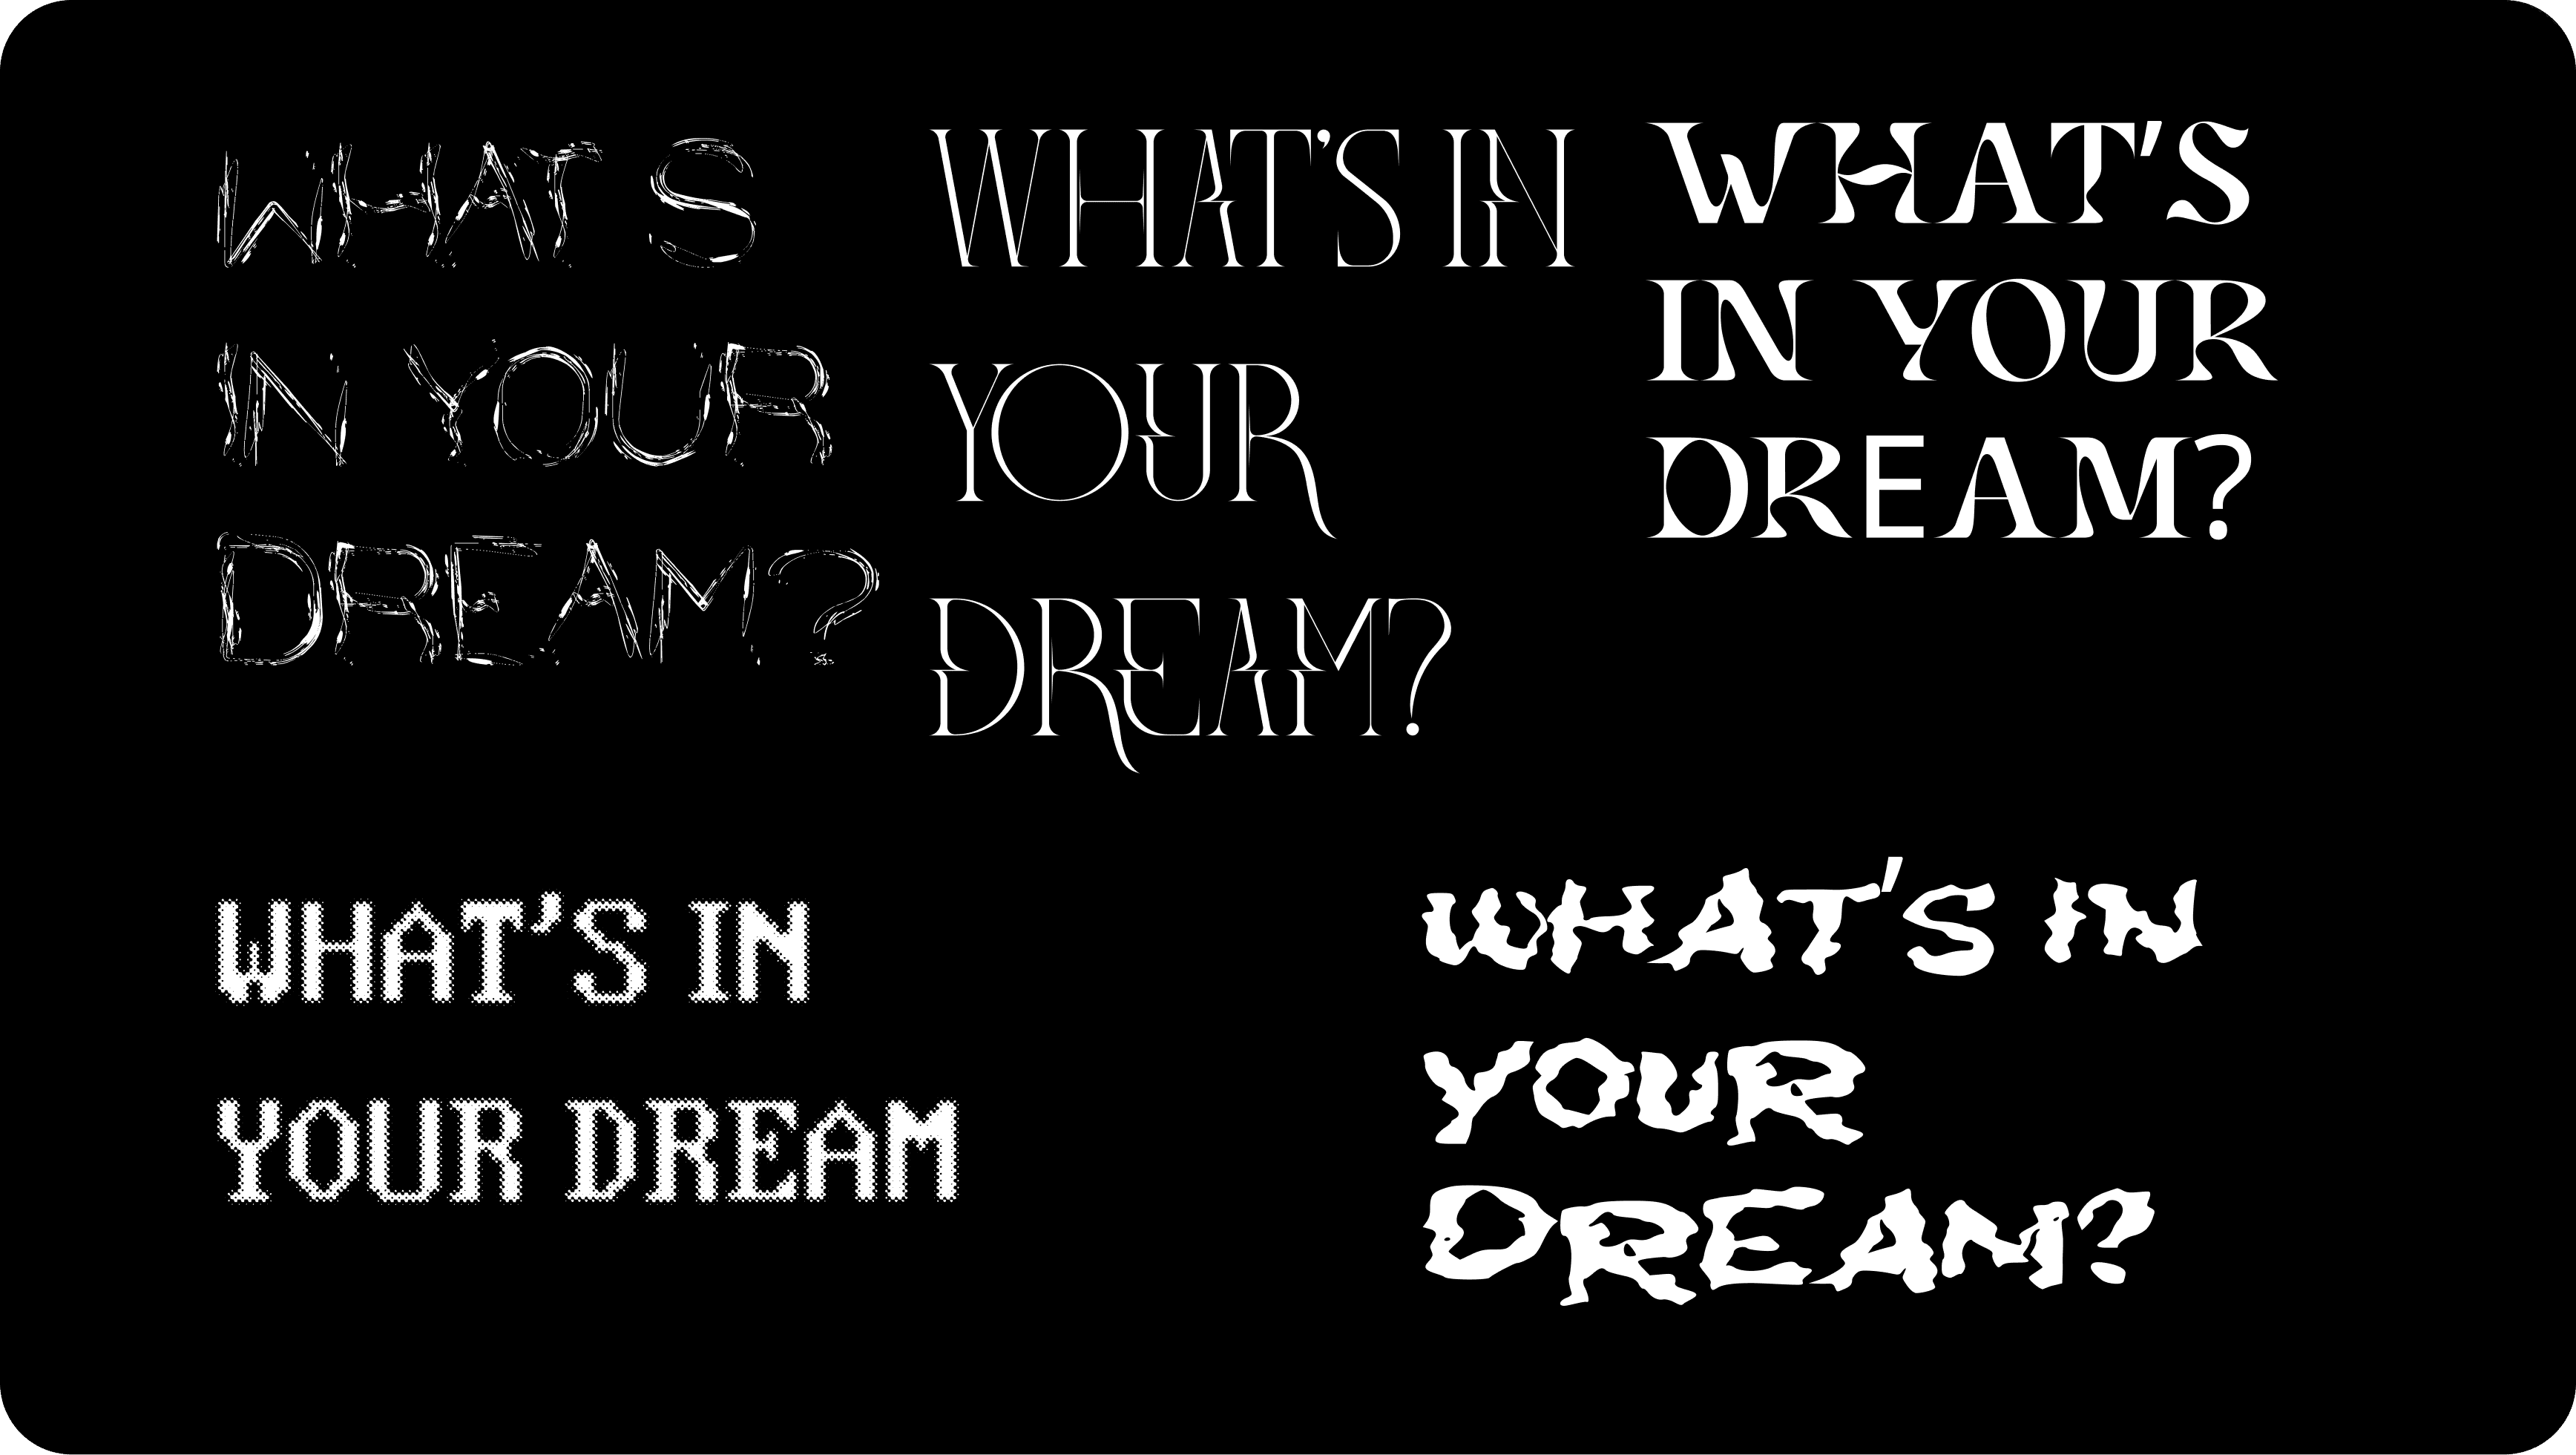
Experiment With Typography
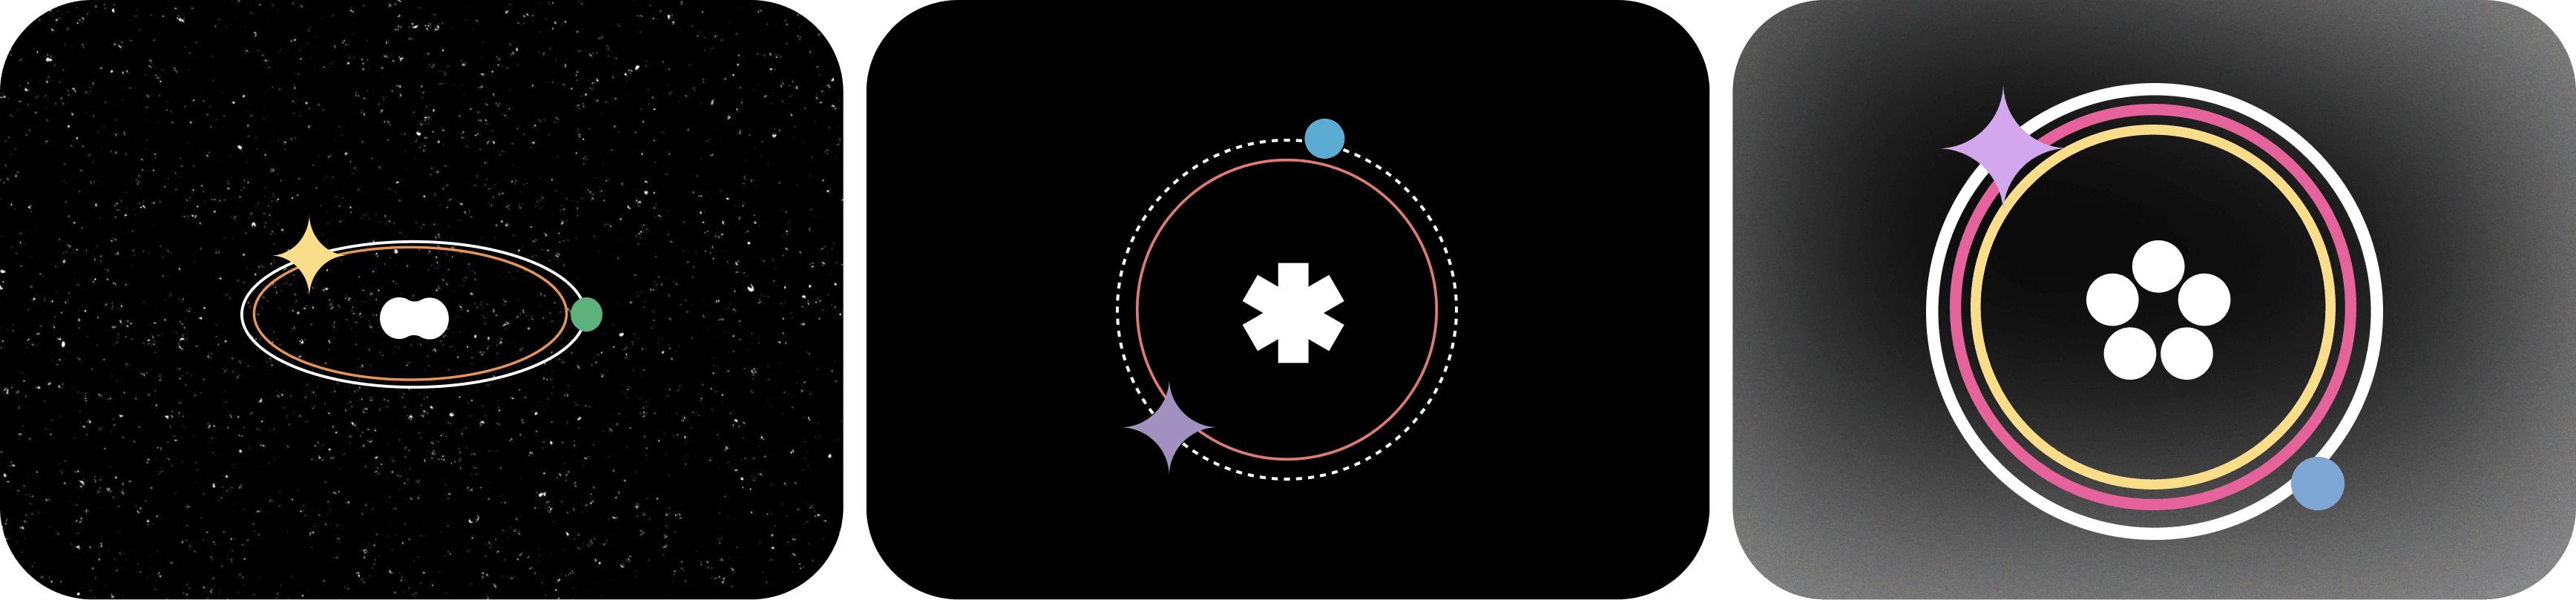
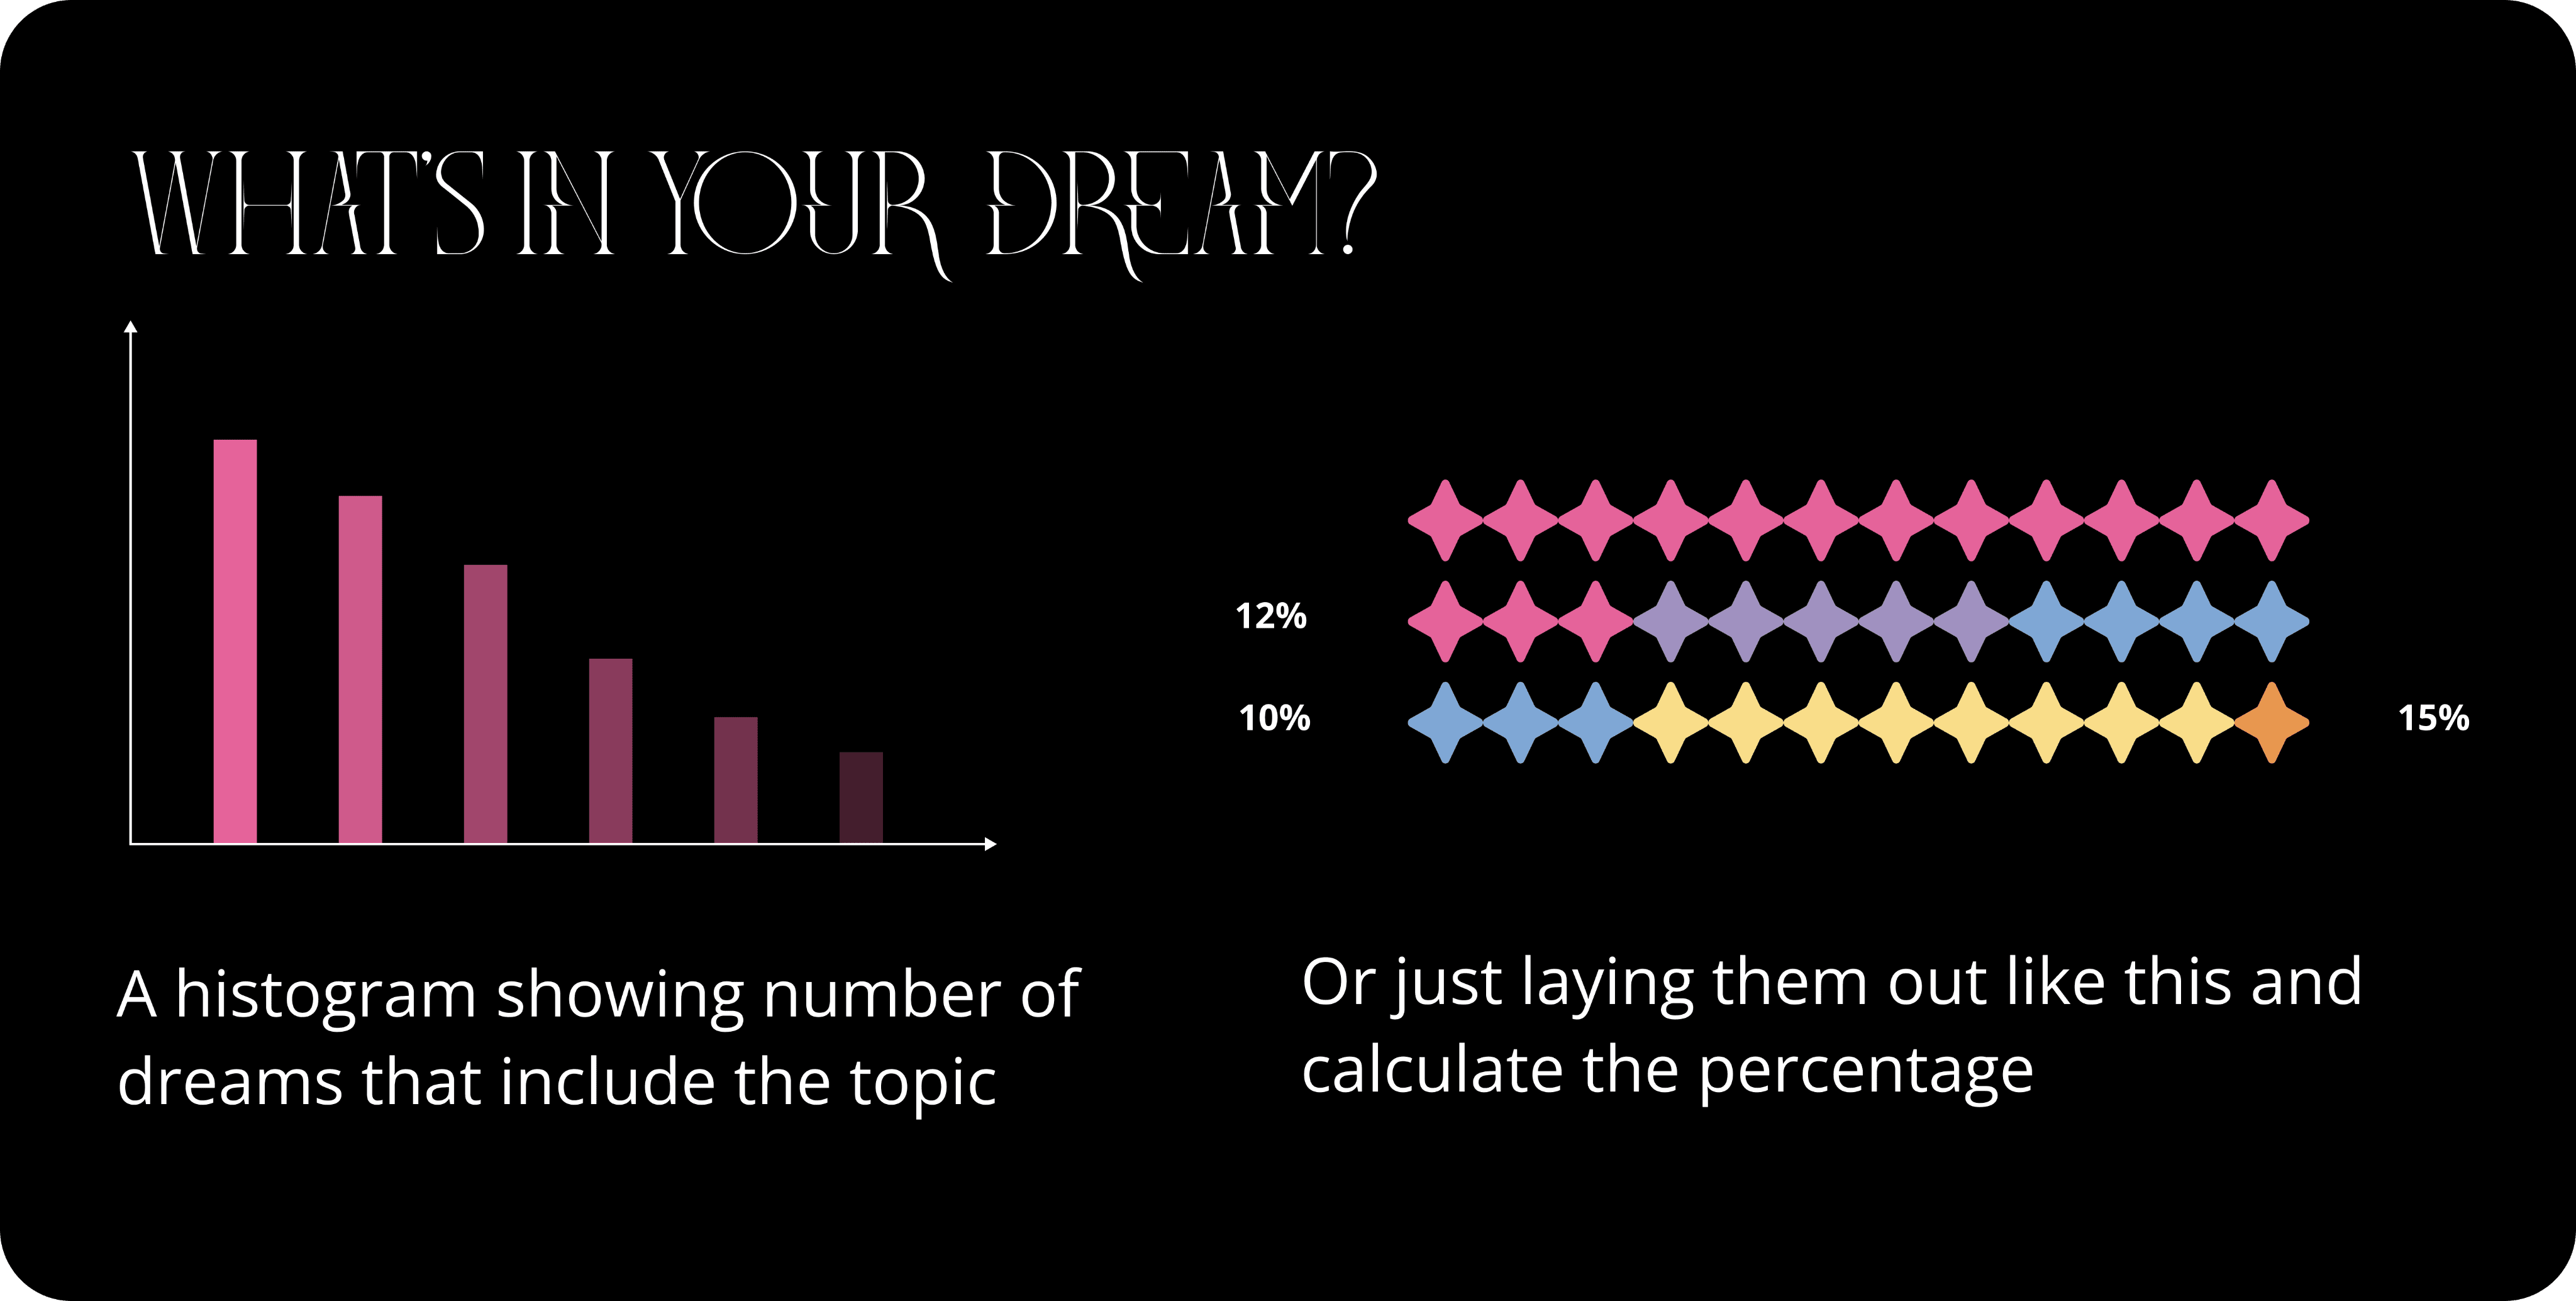
Experiment With Background and Visualization Design
Flying
Being Trapped
Body of Water
Being Chased
Seeing a Monster
Being lost
Women
Men
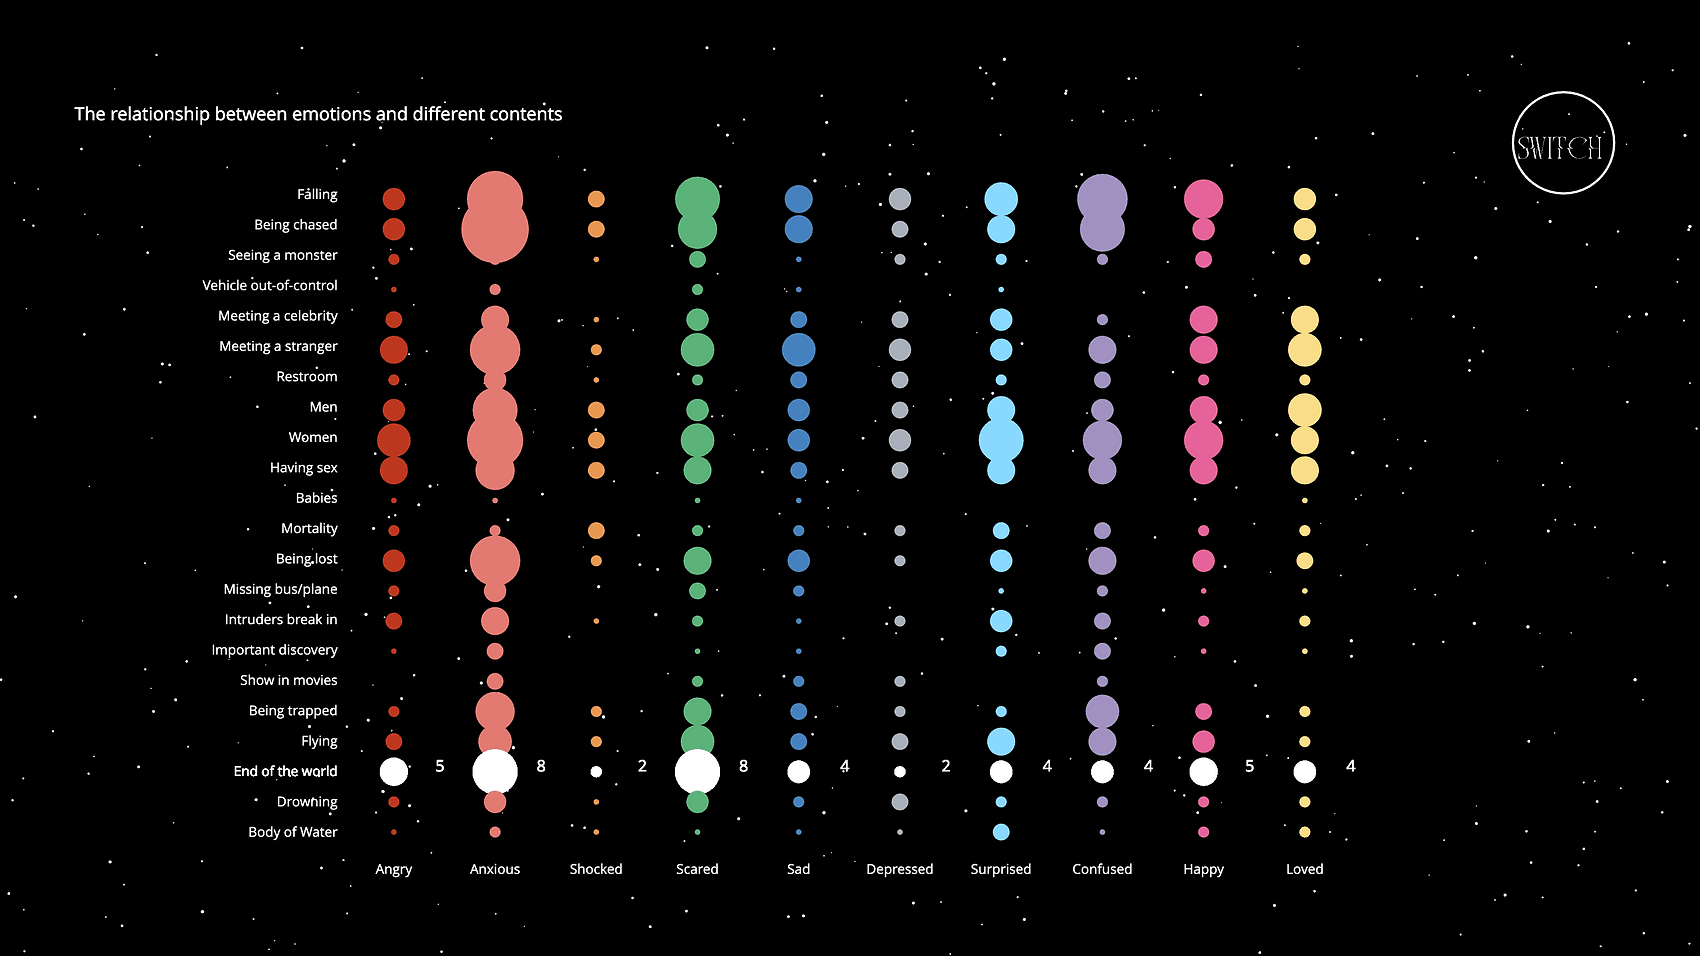
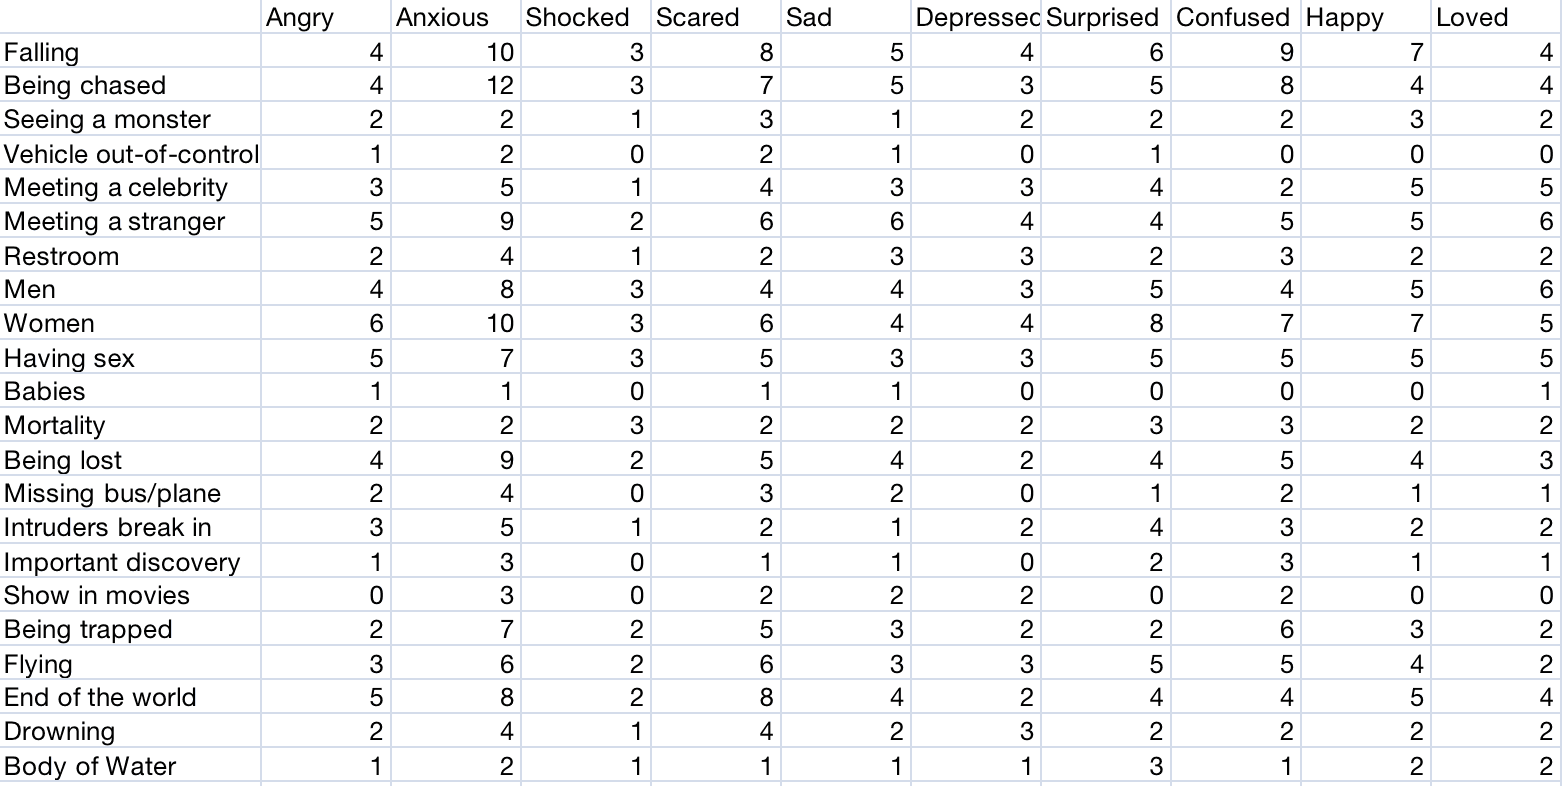
Want some kind of data visualization like this. On the left side is common dream topics, and horizontally are all the different emotions. The size of the circle indicates how often that emotion is associated with that topic, and different emotions have different colors.
fear
sad
loved
happy
More
Less
Experiment With Background and Data Representation
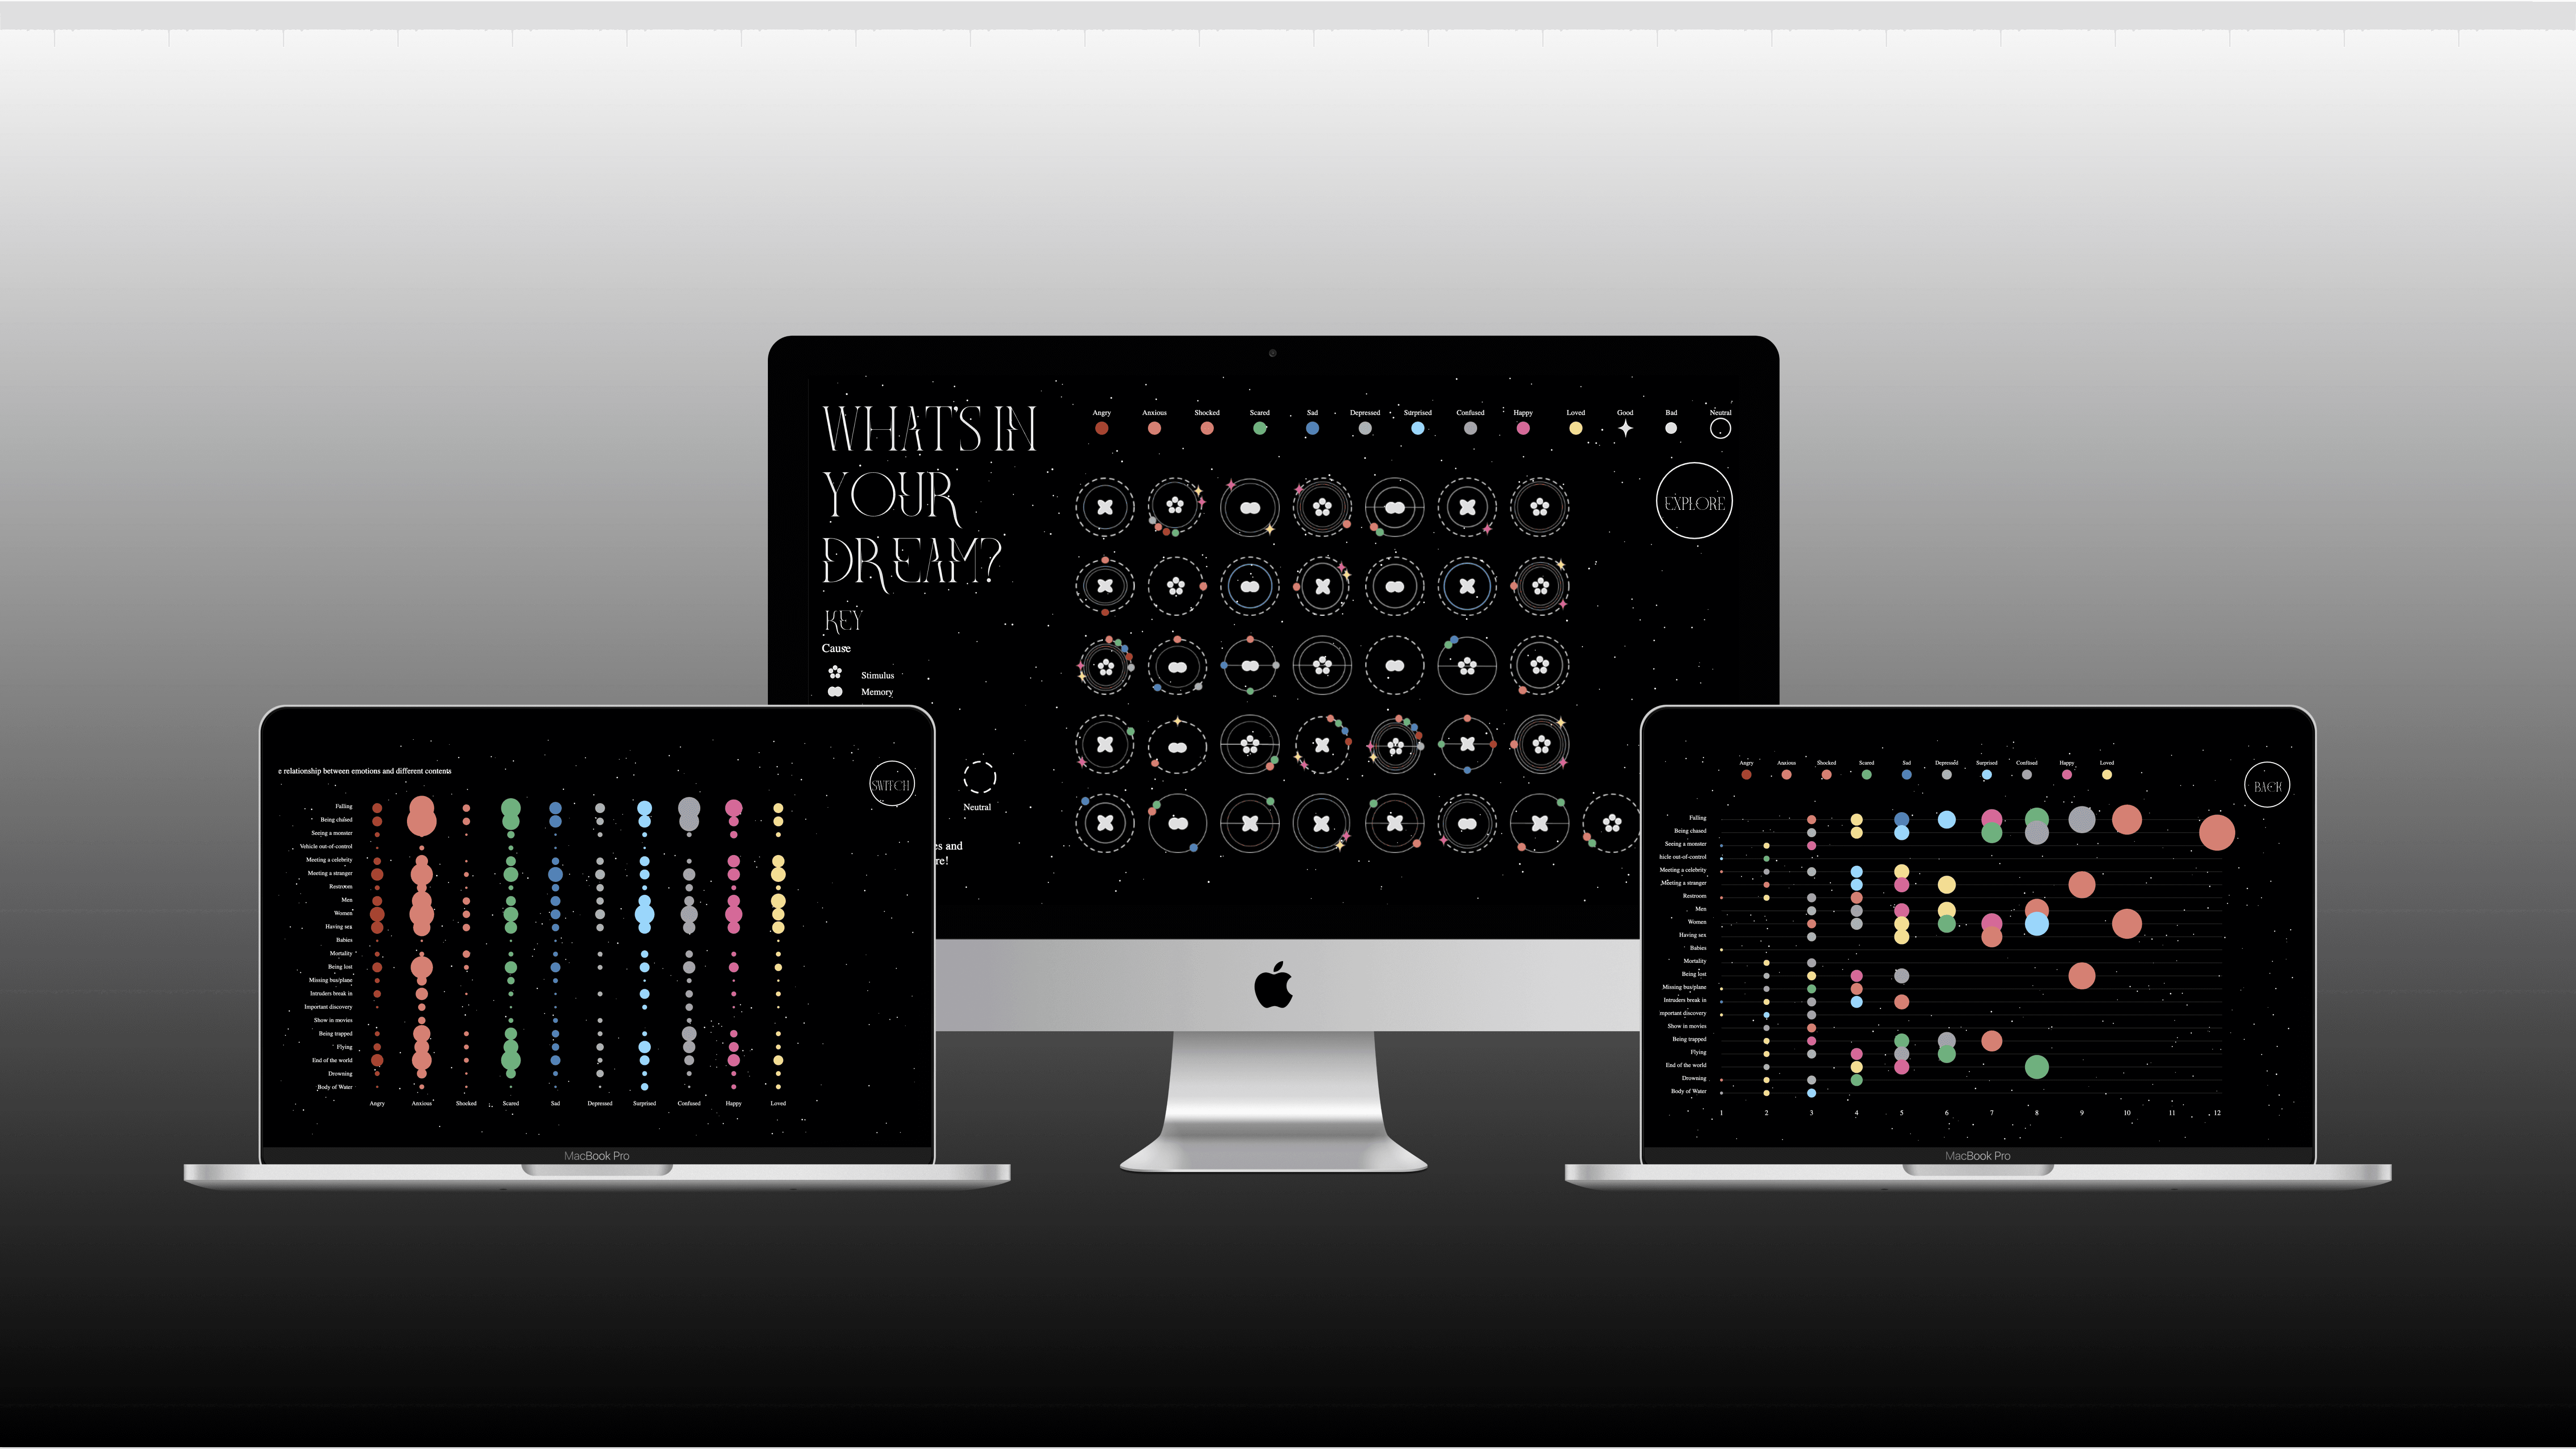
Final Design
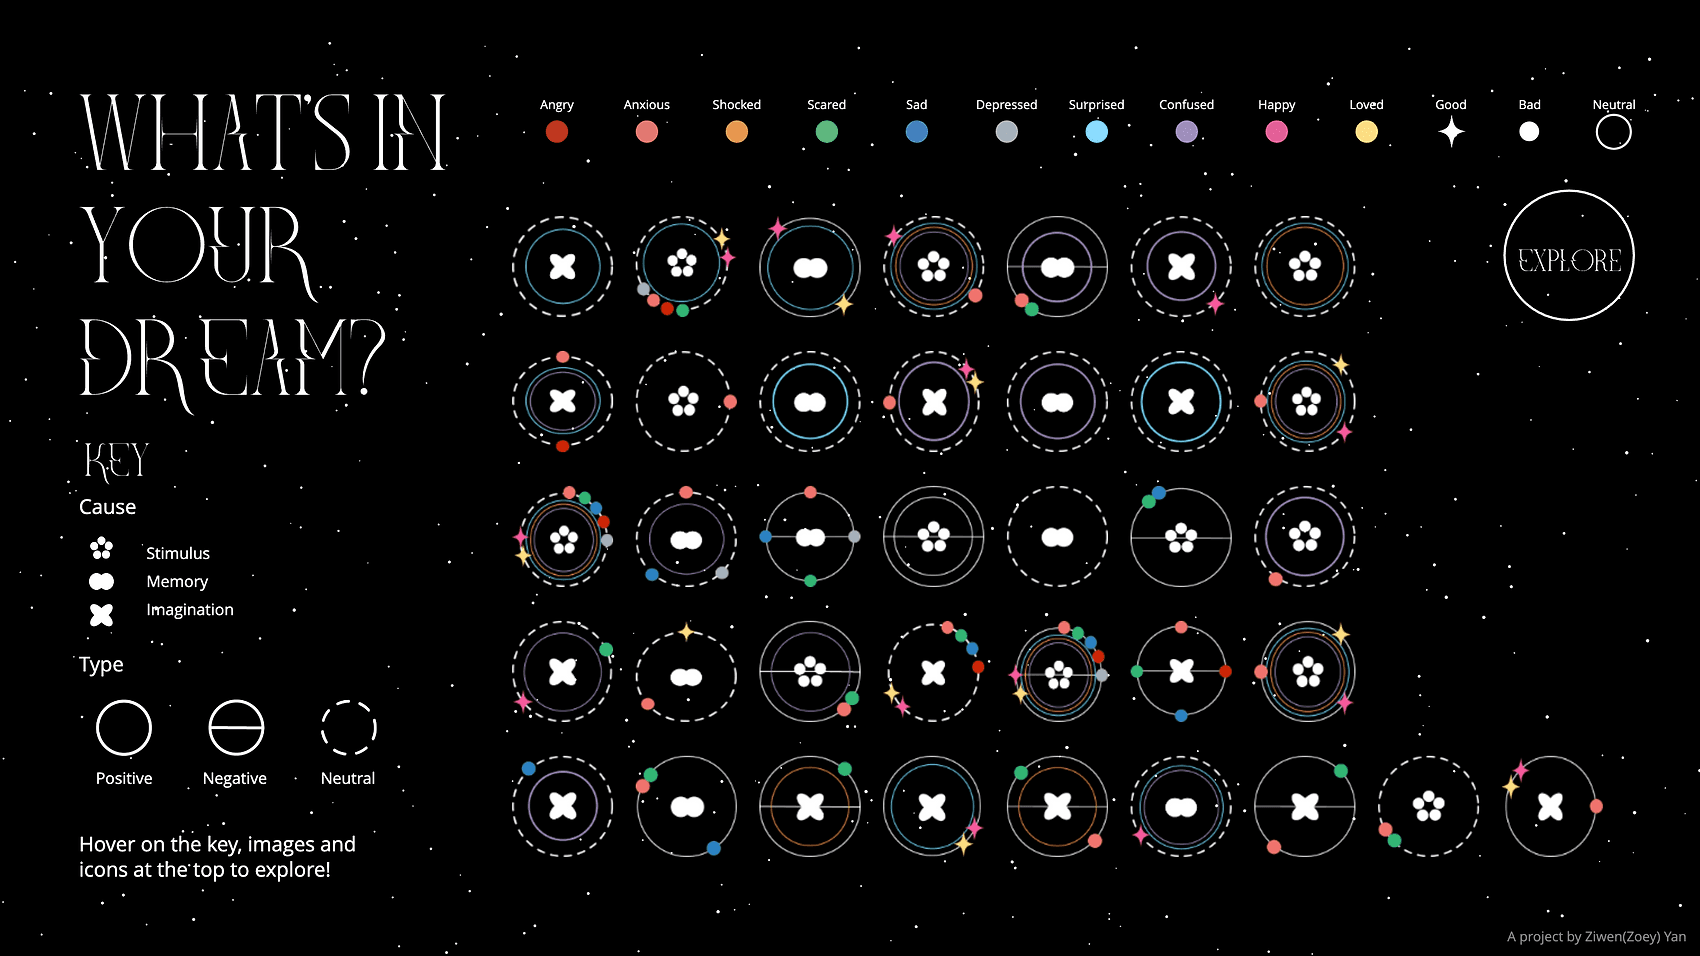
Filters on the side (KEY) and top of the website -> hover to see more information
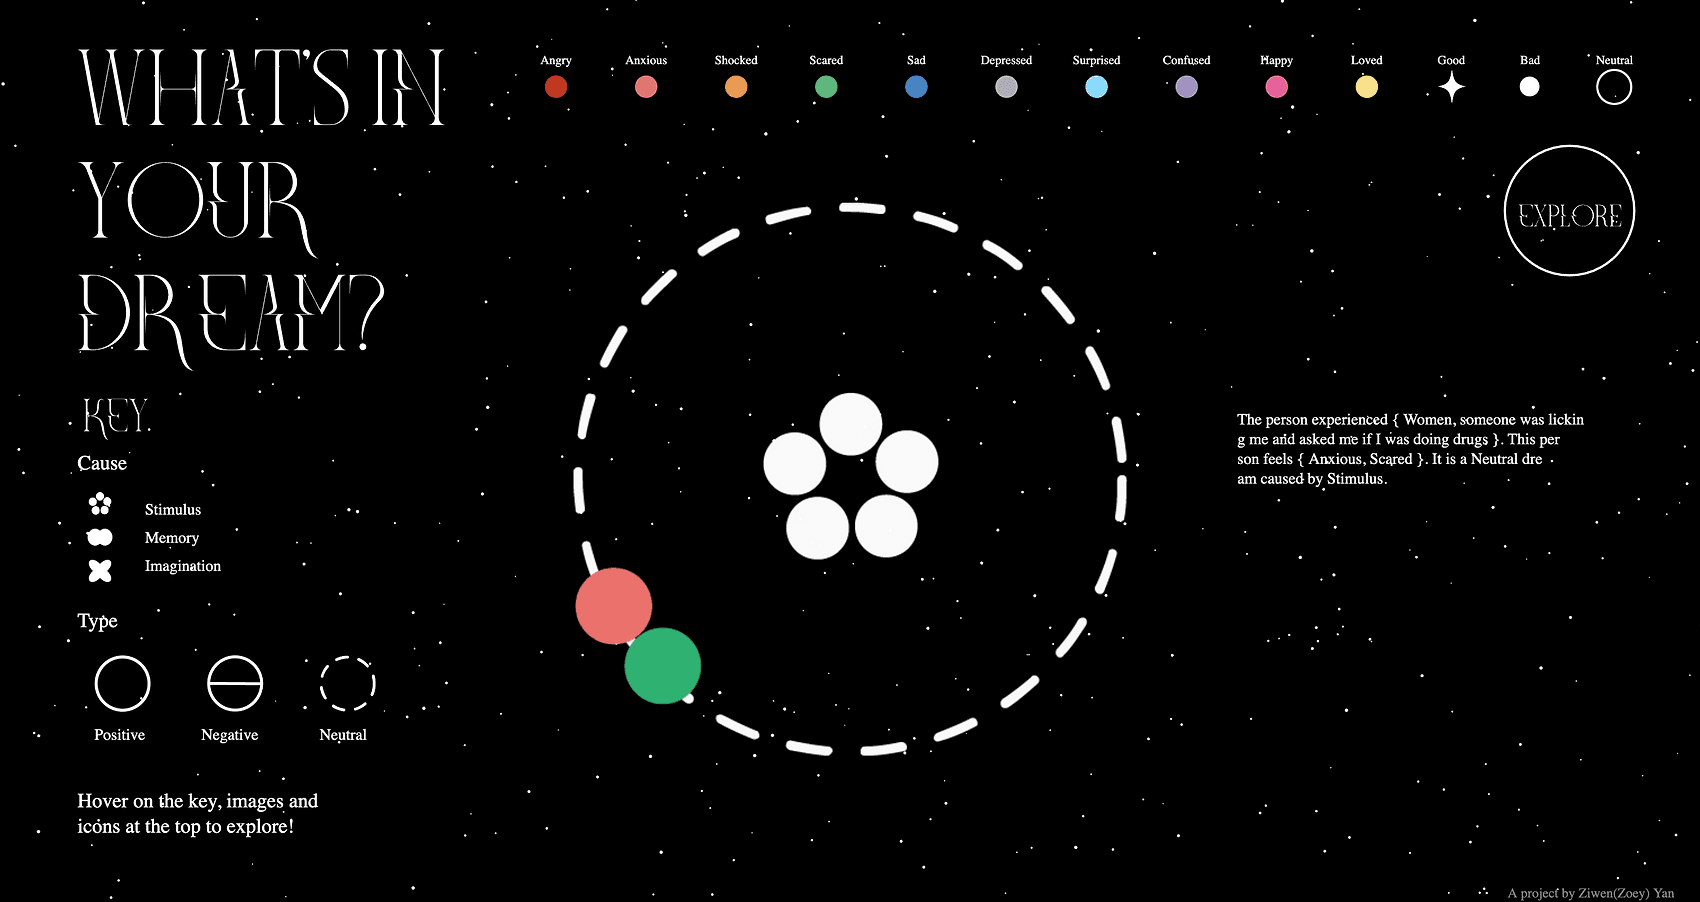
Hover on individual icons to see details about the dream
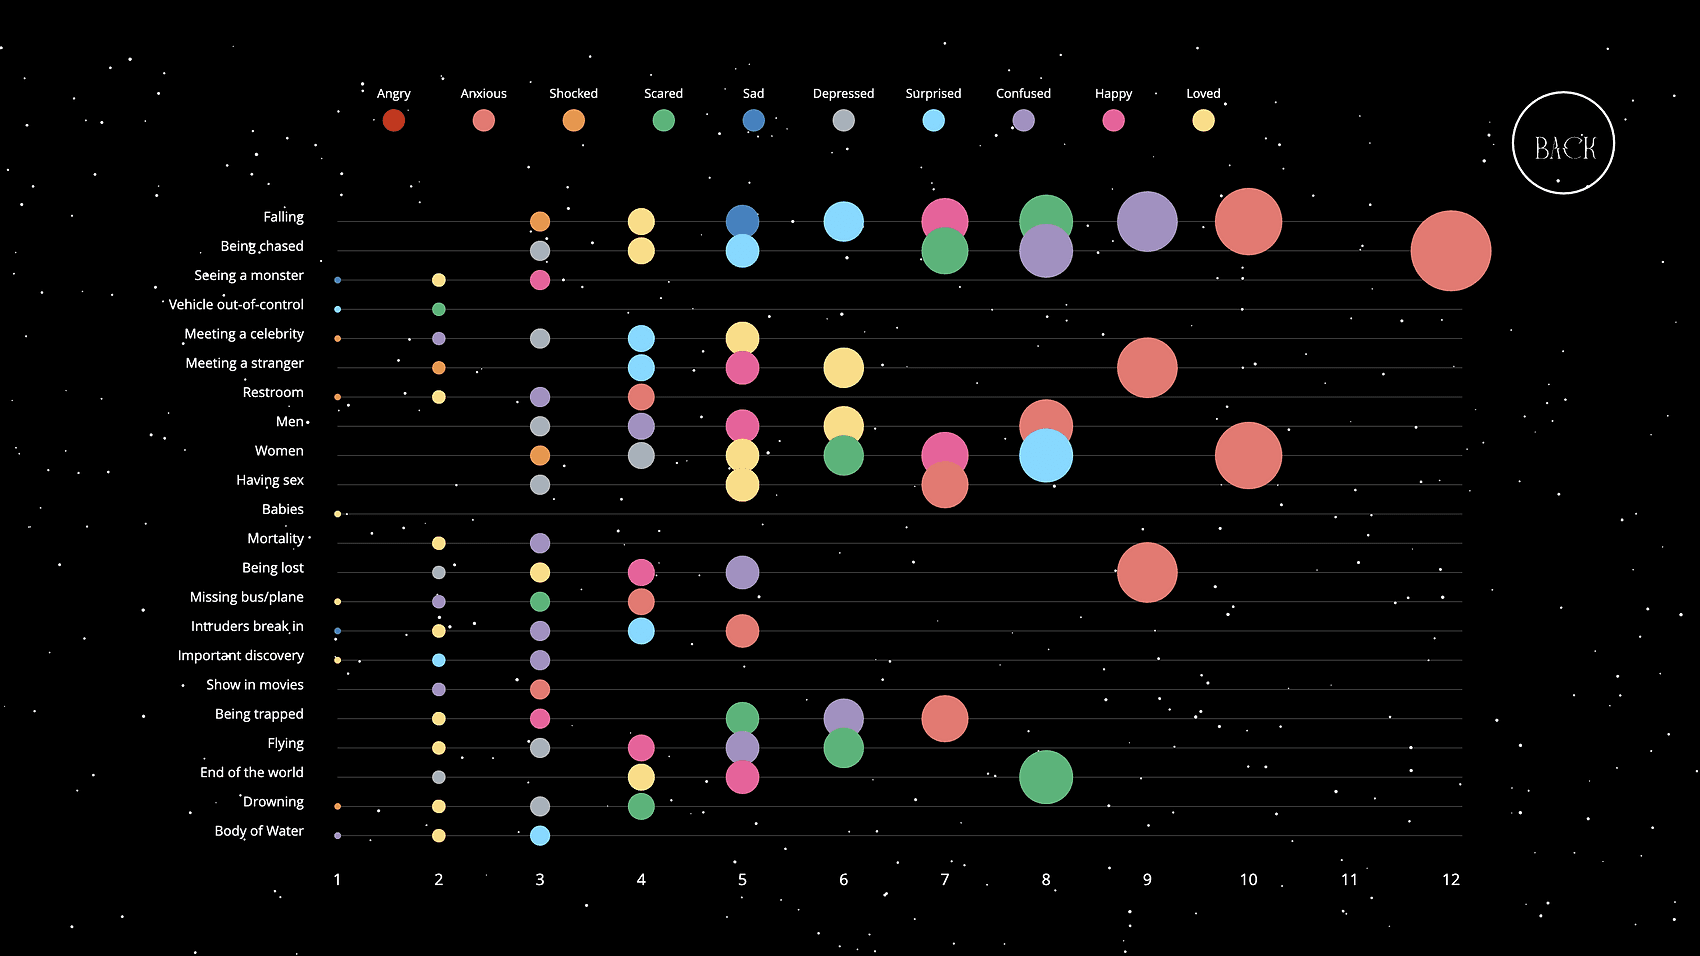
Visualization on the relationship between common emotions (x-axis) and common themes (y-axis)